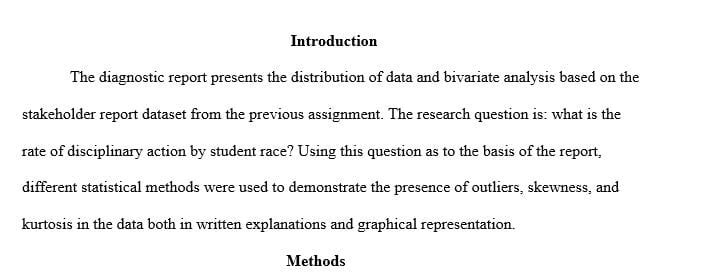
Diagnose and interpret the skewness of at least two different continuous variables.
Use SPSS explore for a continuous variable, and explain why this feature is useful.
Using a continuous variable, demonstrate ability to find outliers. Provide a graphical representation and a written explanation. (If no outliers are present, create an outlier in your dataset to demonstrate this ability.)
Diagnose and interpret the skewness of at least two different continuous variables. Provide a graphical representation and a written explanation. (You may need create continuous variables to demonstrate this ability.)
Diagnose and interpret the kurtosis of at least two variables. Provide a graphical representation and a written explanation. (You may need to create continuous variables to demonstrate this ability.)
Demonstrate homoscedasticity and heteroscedasticity with the data. Provide a graphical representation and a written explanation for homoscedasticity. Provide a graphical representation and a written explanation for heteroscedasticity.
Use SPSS split-file to create box plots for at least one variable. (You will need to create two groups to do this.)
Provide a crosstab and explain the results. Be sure to explain at least (You will need to use either two nominal variables, two ordinal variables, or one ordinal and one nominal variable.)
Answer preview to diagnose and interpret the skewness of at least two different continuous variables.

1629 words


