Business analyst
Assignment Instructions: Project Overview: You are a Business analyst working for Tesla Motors, a leading manufacturer of electric vehicles (EVs) known for its commitment to sustainability and innovation., Your assignment is to explore the relationship between economic indicators and demand for EVs by analyzing real-world data sets. Through the application of statistical analysis, will explore how changes in economic factors influence consumer behavior and demand for EVs
Please prepare a 5-10 slide PowerPoint presentation discussing the following components:
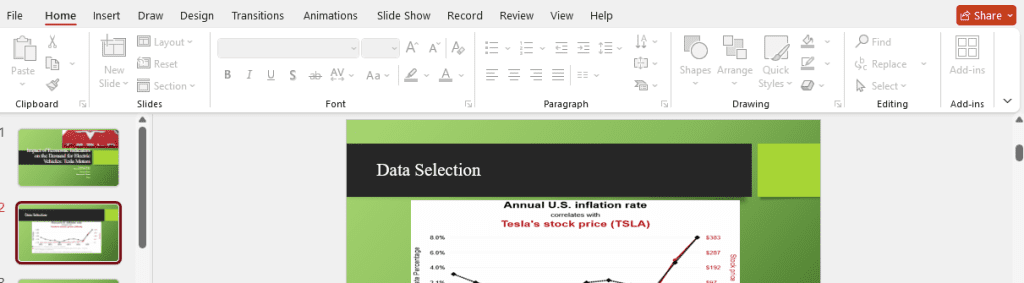
Data Selection:
Students will select a dataset containing both economic indicators (such as GDP, inflation rate, unemployment rate, consumer confidence index) and sales data for a particular product or product category. The dataset should cover a significant time period to capture various economic conditions.
Descriptive Analysis:
Students will conduct descriptive statistical analysis to gain insights into the distribution and trends of both economic indicators and product sales. They will calculate summary statistics, create visualizations (e.g., time series plots, histograms), and identify any notable patterns or trends.
Scenario Analysis:
Students will conduct scenario analysis to simulate the impact of different economic scenarios (e.g., recession, economic recovery, inflationary period) on product demand and assess how changes in economic conditions affect demand patterns.
Interpretation and Recommendations:
Based on their analysis, students will interpret the findings and draw actionable insights for businesses or marketers. They will provide recommendations on how companies can adjust their marketing strategies, pricing strategies, or product offerings in response to changing economic conditions to optimize product demand.
Submit a PowerPoint presentation using the Unit 3 Presentation Template {Power Point] for your assignment and the following requirements:
Length: The assignment should be 10 slides long, excluding the title and reference slides.
Minimum Sources: Include at least 2 scholarly sources to support your analysis. These can include:
Academic journals
Government reports
Industry publications
Market research reports
Citation Style: Use APA format for in-text citations and the reference list.
Slide Design: Ensure slides are well-organized, visually appealing, and free of clutter. Do not use a black or dark background.
Clarity: Use bullet points, charts, and graphs to enhance readability and engagement.
Consistency: Maintain a consistent design and format throughout the presentation.
For each slide in the “body” of your presentation, use the notes section to act as the written component of your assignment. Alternatively, you may record voice-over for each slide.
Paper Format: APA
Answer preview to Business analyst
APA
10PPT
