The relationships based on the scatterplots
10.15 Learning Activity
The overall goal of this learning activity is to visualize the relationship between two scale variables creating scatterplots and to quantify this relationship with the correlation coefficient. In this set of learning activities you will use the data file Bank.sav.
1. Suppose you are interested in understanding how an employees demographic characteristics, beginning salary, and time at the bank and in the work force are related to current salary. Start by producing scatterplots of salbeg, sex, time, age, edlevel, and work with salnow. Add a fit line to each plot. Check on the variable labels for time and work so you understand what these variables are measuring.
2. Describe the relationships based on the scatterplots. Do they all appear to be linear? Are any relationships negative? What is the strongest relationship?
3. Now produce correlations with all these variables. Which correlations with salnow are significant? What is the largest correlation in absolute value with salnow? Did this match what you thought based on the scatterplots?
11.16 Learning Activity
The overall goal of this learning activity is to run linear regressions and to interpret the output. You will use the PASW Statistics data file Census.sav.
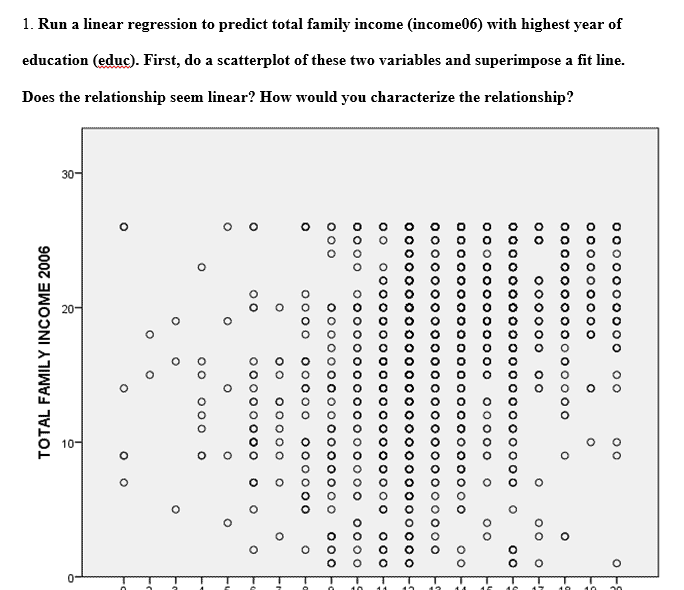
1. Run a linear regression to predict total family income (income06) with highest year of education (educ). First, do a scatterplot of these two variables and superimpose a fit line. Does the relationship seem linear? How would you characterize the relationship?
2. Now run the linear regression. What is the Adjusted R square value? Is the regression significant? What is the B coefficient for educ? Interpret it.
3. Next add the variables born (born in the U.S. or overseas), age, sex, and number of brothers and sisters (sibs). Check the coding on born so you can interpret its coefficient. First, do a scatterplot of age and sibs with income06. Superimpose a fit line. Does the relationship seem linear? How would you characterize the relationship? Why not do scatterplots of income06 with sex and born?
5. Which variables are significant predictors? What is the effect of each on income06? Which variable is the strongest predictor? The weakest?
Answer preview to the relationships based on the scatterplots
APA
769 words
