Introduction
Statistical analysis plays a crucial role in research, allowing researchers to uncover patterns, relationships, and trends within data. Whether in social sciences, business, healthcare, or engineering, understanding statistical methods enhances decision-making and the validity of research findings. In this article, we explore seven essential statistical analysis methods to improve research outcomes, including their applications, advantages, and real-world examples.
Statistical analysis is vital for ensuring research accuracy, reliability, and significance (Field, 2018). By applying the appropriate statistical methods, researchers can draw meaningful conclusions from their data. This article will provide an in-depth discussion of statistical techniques, supported by academic sources and real-world examples.
1. Descriptive Statistics
What It Is
Descriptive statistics summarize and organize data, providing an overview of its main characteristics (Weiss, 2020).
Key Measures
- Mean: The sum of all values divided by the total number of values. It provides a measure of central tendency and is useful for normally distributed data.
- Median: The middle value when the data set is arranged in ascending order. It is less affected by outliers and skewed distributions.
- Mode: The most frequently occurring value in a dataset. It is useful for categorical data and understanding frequency distributions.
- Standard Deviation: A measure of data dispersion that indicates how much individual data points deviate from the mean. A high standard deviation means greater variability.
- Variance: The squared deviation of data points from the mean, used to measure data spread and variability.
- Skewness: A measure of the asymmetry of the probability distribution. Positive skew indicates a right-tailed distribution, while negative skew represents a left-tailed distribution.
- Kurtosis: Indicates the presence of outliers by measuring the “tailedness” of the distribution.
Example
A researcher analyzing student test scores may use descriptive statistics analysis methods to determine the average performance and score distribution. Descriptive statistics are particularly useful in exploratory research to summarize large datasets (Trochim, 2021).
2. Inferential Statistics
What It Is
Inferential statistics allow researchers to make predictions or generalizations about a population based on a sample (Fisher, 2019).
Common Methods
- Hypothesis Testing: Determines statistical significance by assessing whether the observed effects in a sample are likely to be genuine or occurred due to chance.
- T-tests: Compare means between two groups to assess whether they are significantly different from each other.
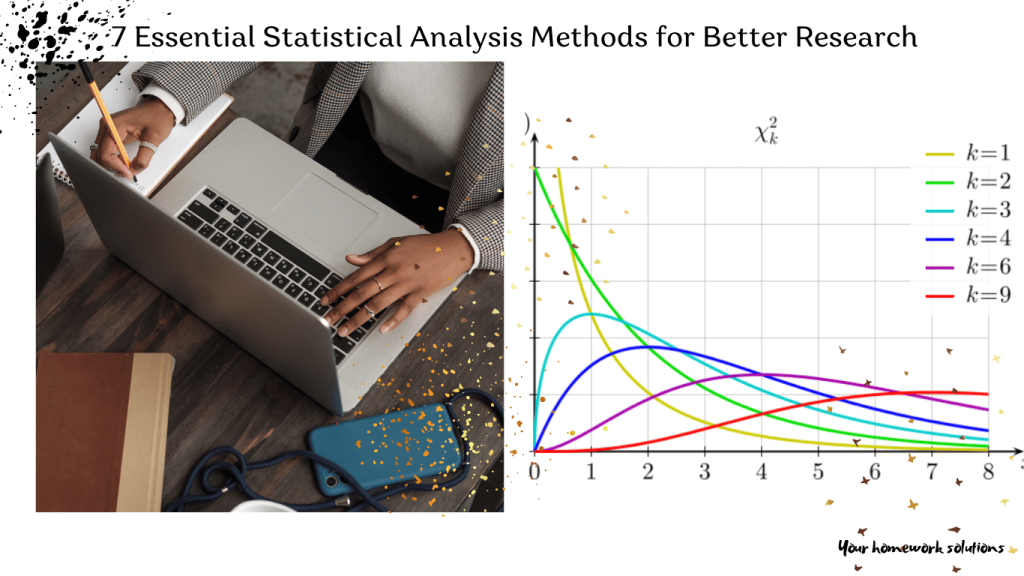
- Chi-Square Tests: Evaluate relationships between categorical variables.
- Z-tests: Used to compare sample and population means when the sample size is large.
- Mann-Whitney U Test: A non-parametric test comparing two independent groups.
- Wilcoxon Signed-Rank Test: A non-parametric test used for paired data to determine if two related samples differ significantly.
- Confidence Intervals: Provides a range within which a population parameter is likely to fall.
- ANOVA (Analysis of Variance): Compares means across multiple groups.
Example
A marketing firm surveying 1,000 customers to predict overall consumer behavior is using inferential statistics. Inferential methods ensure research conclusions are not biased by sample limitations (Weiss, 2020).
3. Regression Analysis in Statistical Analysis Methods
What It Is
Regression analysis identifies relationships between dependent and independent variables, making it a powerful tool for predictive modeling (Montgomery, 2018).
Common Types
- Linear Regression: Examines the relationship between two variables by fitting a straight-line equation to the observed data. It is useful for predicting continuous outcomes and identifying trends.
- Multiple Regression: Involves multiple independent variables to predict a dependent variable. It accounts for the influence of multiple factors simultaneously, making it useful in complex research scenarios.
- Logistic Regression: Used when the outcome variable is categorical. It estimates the probability of an event occurring, making it widely applicable in medical studies, credit scoring, and customer classification.
- Polynomial Regression: Extends linear regression by fitting a polynomial equation, making it useful for modeling nonlinear relationships.
- Ridge and Lasso Regression: These are regularization techniques used to prevent overfitting in multiple regression models by adding penalty terms to the regression coefficients.
- Stepwise Regression: A method of fitting regression models by iteratively adding or removing predictors based on their statistical significance.
Example
A company analyzing the impact of advertising spend on sales revenue may use regression analysis to quantify the relationship. Regression analysis in Statistical Analysis Methods helps in decision-making by quantifying the impact of predictor variables (Montgomery, 2018).
4. ANOVA (Analysis of Variance) in Statistical Analysis Methods
What It Is
ANOVA is used to compare the means of multiple groups to determine if there are statistically significant differences (Field, 2018).
Types of ANOVA
- One-way ANOVA: Compares groups based on one independent variable to determine if there is a statistically significant difference between their means.
- Two-way ANOVA: Examines the interaction of two independent variables and assesses how they simultaneously impact a dependent variable.
- Repeated Measures ANOVA: Used when the same subjects are measured multiple times under different conditions, helping in assessing changes over time.
- MANOVA (Multivariate Analysis of Variance): Extends ANOVA to analyze multiple dependent variables simultaneously.
- ANCOVA (Analysis of Covariance): Combines ANOVA and regression by adjusting for covariates that might influence the dependent variable, increasing statistical power.
- Mixed-Design ANOVA: Incorporates both within-subjects and between-subjects factors, making it useful for studies with repeated measurements across different groups.
Example
A school evaluating the effectiveness of three different teaching methods on student test scores may use ANOVA to compare results. ANOVA helps ensure that observed differences in data are not due to random chance (Trochim, 2021).
5. Factor Analysis
What It Is
Factor analysis reduces data complexity by identifying underlying factors or patterns within a dataset (Weiss, 2020).
Types of Factor Analysis in Statistical Analysis Methods
- Exploratory Factor Analysis (EFA): Identifies potential underlying factors without prior hypotheses. It helps in understanding the structure of a dataset and is commonly used in the early stages of research to identify patterns and groupings in variables.
- Confirmatory Factor Analysis (CFA): Tests predefined hypotheses about factor structure. Unlike EFA, CFA is used to confirm whether a specific factor model fits the data, making it a powerful tool in validating measurement scales and theoretical constructs.
- Principal Component Analysis (PCA): While often confused with factor analysis, PCA is a dimensionality reduction technique that transforms data into principal components, explaining the variance in datasets.
- Common Factor Analysis (CFA): Similar to EFA but focuses more on shared variance among variables rather than total variance.
- Structural Equation Modeling (SEM): An advanced extension of CFA that examines complex relationships among latent variables, often used in social sciences and behavioral research.
- Bayesian Factor Analysis: Incorporates prior distributions in estimating factor models, making it useful for small sample sizes or when prior knowledge is available.
Example
A psychologist using factor analysis to group personality traits from a questionnaire into key categories. Factor analysis is widely used in psychology and market research to identify latent variables (Fisher, 2019).
6. Chi-Square Test
What It Is
A chi-square test determines whether there is a significant association between two categorical variables (Field, 2018).
When to Use Chi-square test in Statistical Analysis Methods
- Testing relationships between gender and product preference to understand market segmentation and consumer targeting.
- Examining the association between educational background and job choice to identify employment trends and workforce planning.
- Investigating whether lifestyle factors such as diet and exercise habits influence health outcomes.
- Determining the relationship between geographic location and political preferences to understand voting behavior.
- Analyzing the impact of social media usage on consumer purchasing decisions.
- Assessing whether economic background affects access to higher education and academic success.
Example
A researcher investigating whether voting preference differs based on age group might use a chi-square test to assess the relationship. Chi-square tests are fundamental in categorical data analysis (Weiss, 2020).
7. Time Series Analysis
What It Is
Time series analysis examines data collected over time to identify trends, patterns, and seasonal variations (Montgomery, 2018).
Common Methods
- Moving Averages: Smooths fluctuations in data by averaging data points over a specific number of periods. It helps identify trends by reducing short-term variations.
- Simple Moving Average (SMA): Calculates the unweighted mean of the previous data points over a given window.
- Weighted Moving Average (WMA): Assigns different weights to past observations, giving more importance to recent data points.
- Exponential Moving Average (EMA): Applies exponentially decreasing weights to past data points, making it more responsive to recent changes.
- ARIMA (AutoRegressive Integrated Moving Average): A comprehensive time series forecasting method that incorporates autoregressive, differencing, and moving average components to model time-dependent data.
- Autoregressive (AR) Model: Uses past values to predict future values.
- Differencing (I): Removes trends to make data stationary.
- Moving Average (MA) Model: Accounts for past forecast errors to improve predictions.
- Seasonal ARIMA (SARIMA): Extends ARIMA by incorporating seasonal patterns.
- Exponential Smoothing: Uses weighted averages of past observations to forecast future values, with greater weight given to more recent data.
- Simple Exponential Smoothing: Best for data with no clear trend or seasonality.
- Holt’s Linear Trend Model: Incorporates a trend component for better predictions.
- Holt-Winters Method: Extends Holt’s model by including a seasonal component for highly fluctuating data.
Example
A financial analyst forecasting stock prices based on historical trends employs time series analysis. Time series methods are essential for economic and financial forecasting (Fisher, 2019).
Conclusion
Mastering these seven statistical analysis methods can significantly improve research quality, ensuring more reliable and insightful results. Whether analyzing consumer behavior, forecasting economic trends, or conducting scientific experiments, these techniques provide the foundation for sound decision-making. Researchers should choose the appropriate method based on their data type and research objectives to derive meaningful conclusions.
Statistical techniques not only validate research findings but also enhance their applicability across disciplines (Trochim, 2021). Future research should focus on integrating these methods with emerging technologies like artificial intelligence and machine learning to further improve data analysis capabilities.
References
For additional reading and external resources, consider the following links:
- References
- For additional reading and external resources, consider the following links:
- National Institute of Standards and Technology. (2021). Engineering Statistics Handbook. Retrieved from https://www.itl.nist.gov/div898/handbook/
- UCLA Institute for Digital Research and Education. (2022). Statistical Consulting Resources. Retrieved from https://stats.idre.ucla.edu/
- Harvard Data Science Review. (2021). Statistical Methods and Applications. Retrieved from https://hdsr.mitpress.mit.edu/
- The Royal Statistical Society. (2023). Statistical Research and Reports. Retrieved from https://rss.org.uk/
- Field, A. (2018). Discovering Statistics Using IBM SPSS Statistics. SAGE Publications.
- Fisher, R. A. (2019). Statistical Methods for Research Workers. Oxford University Press.
- Montgomery, D. C. (2018). Introduction to Statistical Quality Control. Wiley.
- Trochim, W. M. (2021). Research Methods: The Essential Knowledge Base. Cengage Learning.
- Weiss, N. A. (2020). Introductory Statistics. Pearson Education.
- Anderson, D. R., Sweeney, D. J., & Williams, T. A. (2020). Statistics for Business and Economics. Cengage Learning.
- Hair, J. F., Black, W. C., Babin, B. J., & Anderson, R. E. (2019). Multivariate Data Analysis. Pearson Education.
- Agresti, A. (2018). Statistical Methods for the Social Sciences. Pearson Education.
- Jaccard, J., & Becker, M. A. (2020). Statistics for the Behavioral Sciences. Cengage Learning.
If you need any help with writing your Statistical Analysis Methods research paper, we have the best tutors in the market to help you. Ask your question here
